Dan Wolf | Living Rightly
On May 30, the Virginia Senate passed a fiscally irresponsible and immoral budget approved earlier by the House of Delegates. Budgeted expenses are projected to grow from their present $51.8 billion in 2018 to $57.0 and $58.9 billion in 2019 and 2020, single year increases of 11% and 14% respectively over present spending levels. A large part of this increase comes from an approximately $3.6 billion per year expansion in Medicaid program spending, with an accompanying false claim of moral compassion to promote the need for same. Some of this program’s expansion is to be financed by a new $600 million tax on the hospitals receiving program expenditures in return for providing Medicaid healthcare services. This article looks closer at the spending increase and compassion claim.
Virginia Government Expenditures
The chart below presents Virginia government’s spending growth by area over the last 25 years. The figures come from the annual NASBO (National Assoc. of State Budget Officers) reports, and represent only the state funds spent annually.
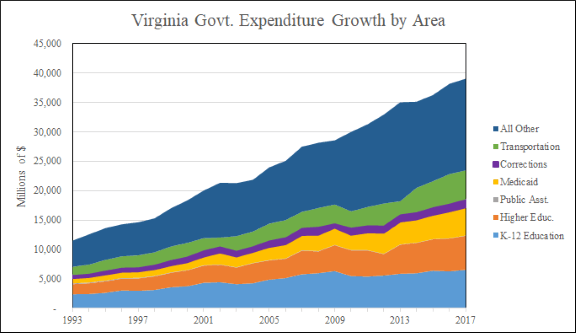
Figure 1: Virginia Expenditures by Year[1]
Total state expenditures have increased by 171% in the twenty-five years shown, for an average annual growth rate of 4.25%. Most organizations can only dream of being able to absorb that level of consistent long-term expense growth. The largest spending growth during that time came from Medicaid program expenses. It should be mentioned that Medicaid is partially funded by the federal government. However, since this article focuses on the Virginia state budget, unless otherwise noted, the Medicaid figures presented relate only to state expenses.
State Expense Growth
The table below shows each expenditure area from the above graph as a percentage of total spending at the beginning and end of the twenty-five year period. It then presents the average annual growth rate for each named area during that same period.
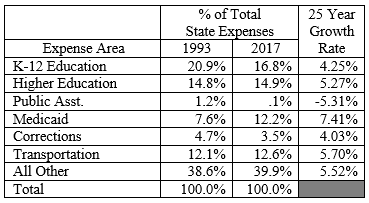
The figures not only show Medicaid being by far the fastest growing component of state expenses, but it is almost the only budget area that is now a larger part of the budget than it was twenty-five years ago, increasing from 7.6 to 12.2% of total state spending.
Politicians have occasionally claimed state spending needed to increase to pay for specific needs in education, transportation, and other areas. The truth is that the constant increases in Medicaid spending has left the state with no viable options other than to increase overall spending, and taxes to fund those spending increases—regardless of what they claim. Medicaid spending growth itself has taken away whatever flexibility the state had to shift funding between areas when needed. Government is not costless. Nothing is received for free, it may just merely be free to you. Someone else is paying the bill.
Virginia Total Medicaid Expenses
The chart below presents total Virginia Medicaid expense growth (both state and federal) over a 28 year period. The first twenty-five years come from the same information source noted in Figure 1. The 2017 figure is the estimated expense data from the most recent NASBO report, and the 2018 – 2020 figures come from the current Virginia state budgets.
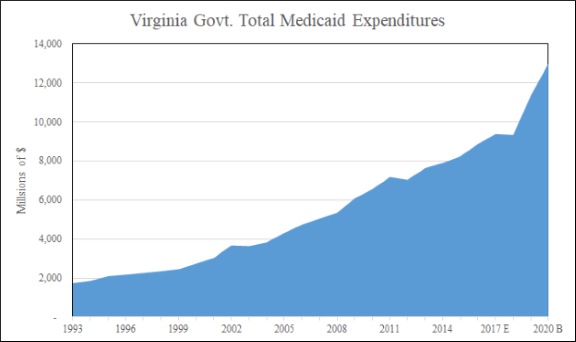
Figure 2: Virginia Growth in Total Medicaid Expenses, 1993-2020[2]
Total Medicaid expenses grew by $7.7 billion from $1.7 to $9.4 over the twenty-five years from 1993 to 2017, representing an annual growth rate of about 7.0% over that time. But in just the next three years total Medicaid expenses will increase by another $3.6 billion, almost half of the increase it took twenty-five years to incur, representing an annual growth rate of about 11.5% for the next three years alone.
Let me make one thing clear, I believe in compassion. Christian principles revolve around compassion, charity, and the responsibility of being a good steward of what you’ve been blessed with. As Christians we have an obligation to speak out when those principles are corrupted. Compassion is taking actions with your own resources, not taking actions with others resources. Charity is about providing another what they need to become independent from your own resources, and not making another person dependent by giving them things. Taxes are other people’s resources. The questions that need to be asked include; is the state making good decisions on what it spends money on, are its decisions cost-effective, and as public servants are they being good stewards of what’s been entrusted to them? This analysis is limited to Medicaid spending alone.
The Hollow Compassion Argument
Three arguments are presented on economic, stewardship, and effectiveness grounds. All relate to the government’s ability to manage its financial and moral responsibilities.
Economic
Federal matching expanded under the Obamacare legislation in an attempt to bribe states into accepting its mandates. The match is 100% for the first three years, which then drops to 95% and eventually falls to 90%. However, the Medicaid program itself presents perverse incentives that lead to overspending while at the same time creating enormous healthcare access problems for the very people the program was intended to assist. With the historical expense growth noted earlier, and continuing federal deficits, it is lunacy to think that there will be enough money in the long-term for the federal government to meet its Medicaid commitments—let alone the state meeting its own commitments under this program. This is using short-term money to fund a long-term commitment, poor management decision making that must result in future tax increases to cover what will become continued revenue shortfalls as expenses grow and revenue decreases.
Stewardship
Building on the above argument, government is not costless. On average, the federal government only provides about $ .30 in services for each $1 it takes in. And that federal money is not free, it comes from us, just as the state money does. So we send money to DC, they take on average $ .70 and give the remaining $ .30 to the state. Then the state takes additional administrative expenses, and what is left goes out the door to Medicaid recipients. Such actions would be criminal if they were not being done by the government.
Better stewardship could be provided by private organizations, charitable or otherwise. Private charities consume on average only $ .25 in administrative expenses for each $1 they take in, leaving about $ .75 available for program benefits. Even if a private organization consumed $ .50 out of each $1 earned, it would still be a significant improvement over typical government performance.
Better stewardship could be attained by removing the federal government from an area they have no constitutional authority for in the first place, and leaving it to private organizations. The states do have the authority to have healthcare assistance programs based on their individual constitutions. The real question is should they do it? Can they exercise good stewardship and service by participating in Medicaid. History would suggest that is not the case with the Medicaid program.
Effectiveness
Finally, we can ask does Medicaid even work? This is one of the programs that are part of the ‘War on Poverty.’ In looking at the expenditures and results over the last 50 years, these programs have been an absolute failure. We’ve spent trillions of dollars, and poverty is at the same level as when the program began, and in fact it has increased as expenditures have increased. People behave the way they are incented.
The following graph provides telling information on general population growth, means tested poverty program spending, and the number of people in or just above poverty.
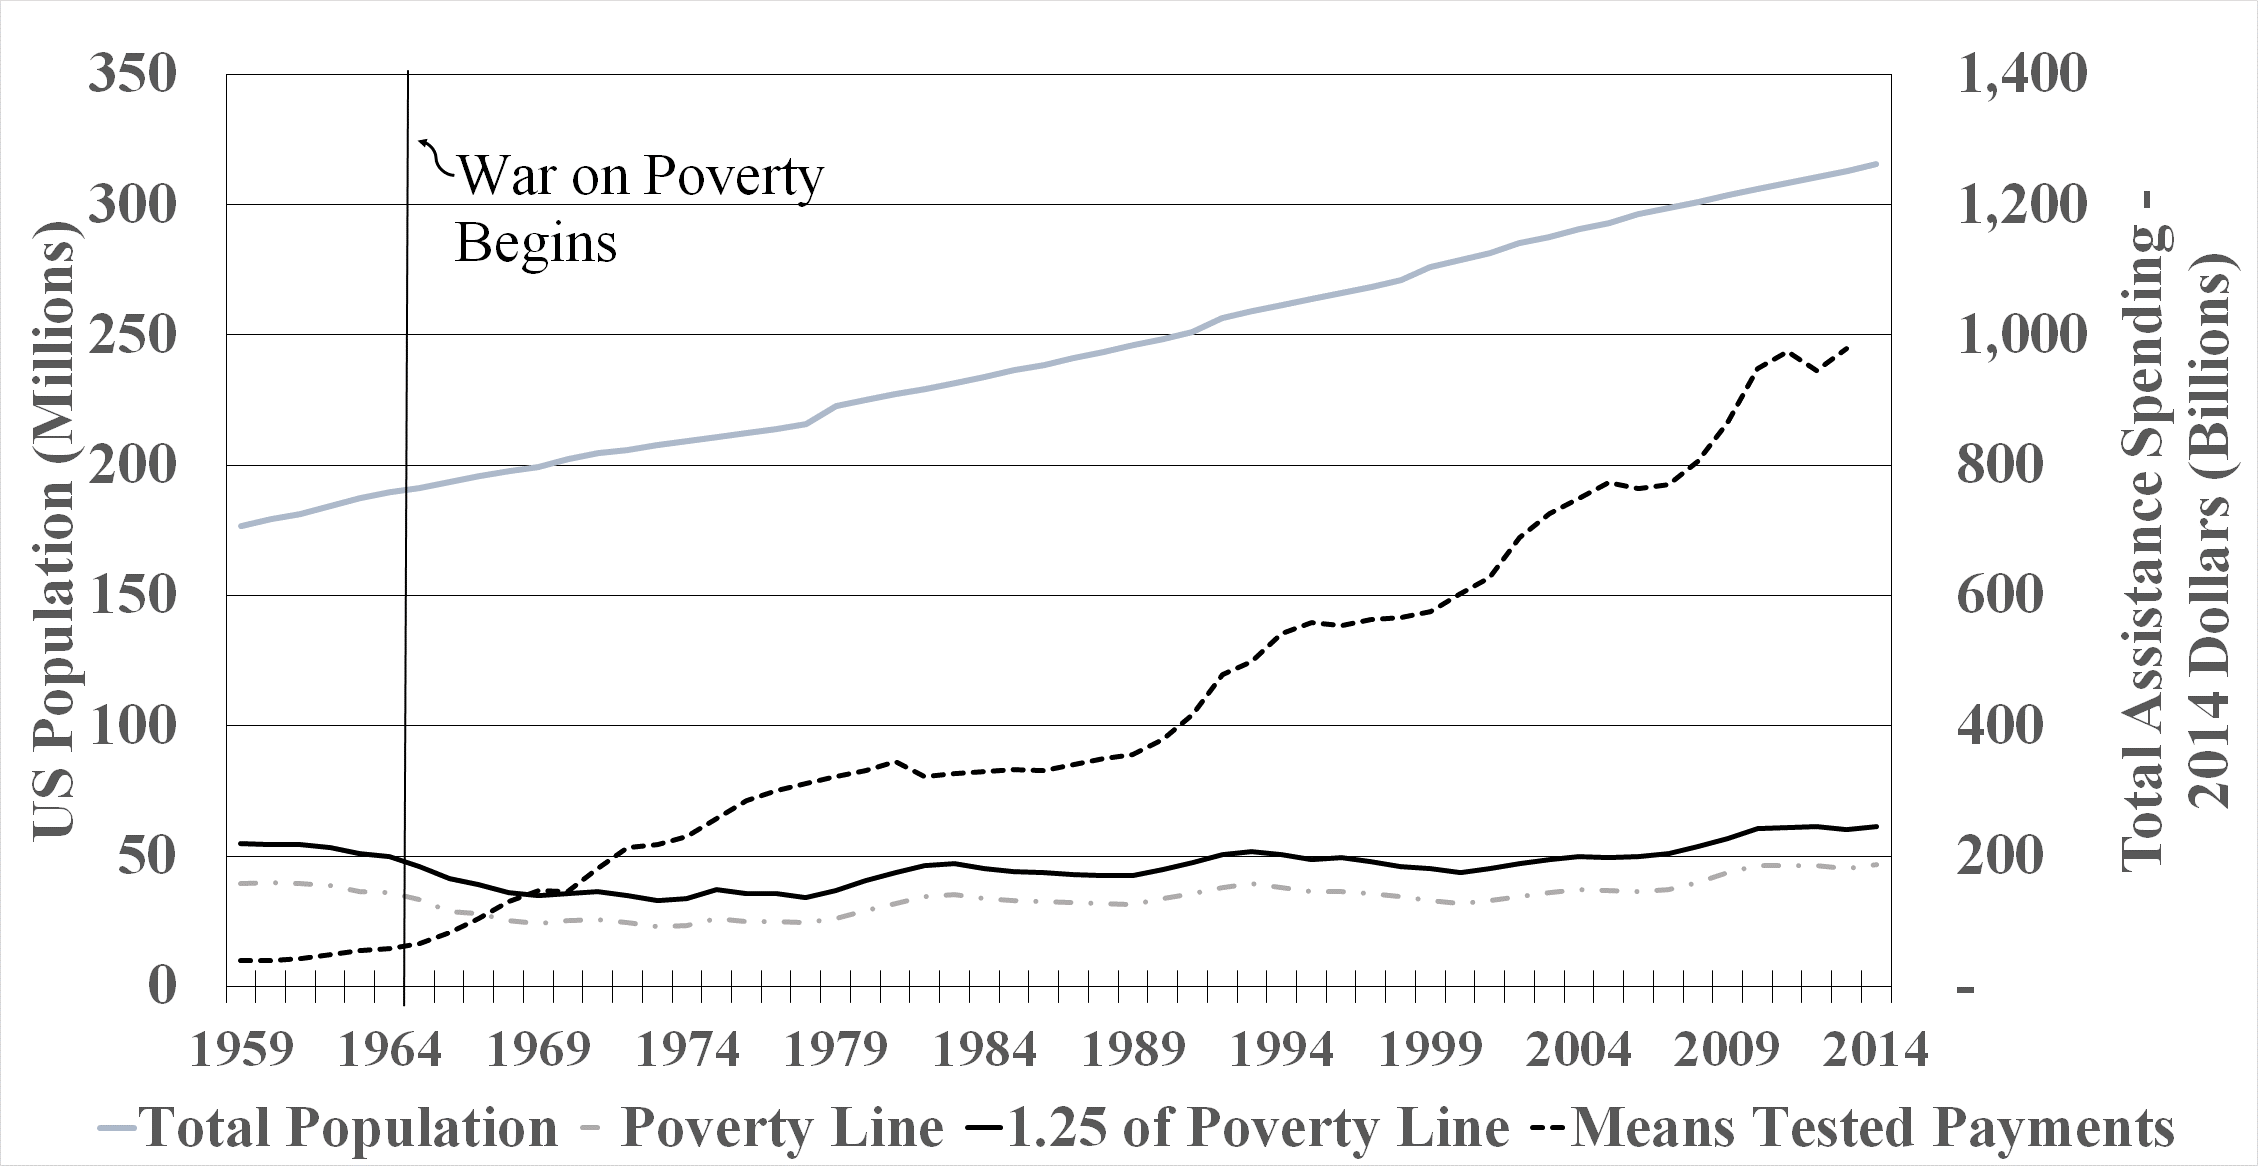
Figure 3-: US Total and Poverty Populations, Annual Public Assistance Expenditures, 1959-2014[3]
It is remarkable that poverty levels were on their way down all by themselves before the war on poverty began, and that progress stalled and then began to reverse after programs began to be implemented in 1969. But the raw numbers don’t always tell the tale. So the same information is presented in percentage terms in the graph below.
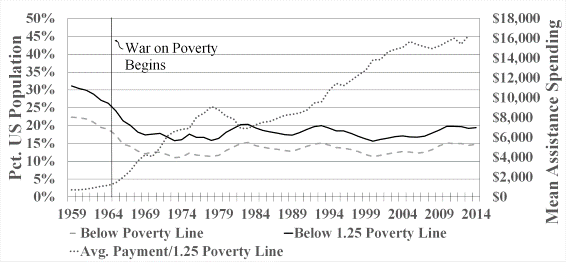
Figure 4: US Percent At or Near Poverty and Mean Assistance Spending, 1959-2014[4]
Medicaid and SNAP (food stamps) spending make up by far the bulk of assistance spending. Both continued to increase after their promotion by the Obama administration. The graph below shows the percentage of the Civilian Non-Institutional Population (CNP) receiving assistance benefits by type.
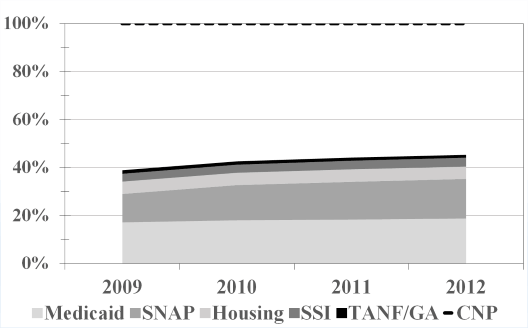
Figure 5-: Percentage of CNP, Ages 16-64, Receiving Public Assistance, 2009-2012[5]
These so-called safety nets are in reality safety-webs, entrapping those who partake of their services, in effect making them economic slaves. That is neither compassionate nor right. Instead it is about money and power, vice parading itself as virtue.[6]
Conclusion
On the basis of economic, stewardship, and effectiveness; passing this budget was an irresponsible action—a demonstration of bad management. However, it is not necessarily the politicians fault. Aren’t they just carrying out the wishes of those who elected them? Doesn’t the fault lie with us, for putting people who would make these kind of decisions into office in the first place and then allowing them to continue in those positions after making really bad decisions. If we want things to change, then we must change ourselves and our leadership. Every person who voted to pass this budget should be removed from office. We have a chance to start that process on June 12.
Dan Wolf is a researcher, analyst, and author. He has written four books examining the relationship between faith, freedom, virtue, and charity. Together these form the cornerstone of our purpose, and our society’s foundational principles derived from those relationships. Links to his work can be found at his Living Rightly website.
[1] National Association of Stage Budget Officers, State Expenditure Reports, https://www.nasbo.org/mainsite/reports-data/state-expenditure-report. Accessed June, 2018.
[2] Virginia Medicaid expenses from 1993-2016, Ibid. Budget expenditures for 2018 – 2020 come from the Virginia state budget web-site at https://budget.lis.virginia.gov/. Accessed, June, 2018.
[3] Population statistics from the US Census Bureau, https://www.census.gov/hhes/www/poverty/data/historical/people.html, Table 6, accessed March, 2016.
Government assistance figures from Rector, Robert and Sheffield, Rachel, The War on Poverty After 50 Years, The Heritage Foundation, September, 2014. Accessed January, 2016.
[4] Rector, Robert and Sheffield, Rachel, The War on Poverty After 50 Years, The Heritage Foundation, September, 2014. Accessed January, 2016.
[5] Wolf, Dan, p. 180, Collectivism and Charity, living rightly publications, 2016.
[6] For readers interested in learning more, chapters on the war on poverty and American education, as reflected against Christian principles, are presented in Wolf, Dan, Collectivism and Charity: The Great Deception, living rightly publications, 2016.
