The Left is Right
I wasn’t sure if this was the right time for this article. But after the left’s reporting and antics over the last couple of weeks about all that is supposedly wrong, I think we deserve a little reality. Liberals have proudly announced this last years economic growth is due to the Obama administration, and I think they are right, but not for the reasons they claim.I have to admit though, this article didn’t quite turn out the way I initially expected. I thought I would simply look at some of the underlying economics and see changes in direction or amplitude since early 2017—changes from the previous administration. The underlying story would be about policy, and while that is part of it, there is more. This article examines some changes in population demographics, gross domestic product, small business dynamics, and confidence in an attempt to tease out some inferences on why things changed.
Population Demographics
Over 3 million new jobs have been created since January of 2017, and record low unemployment rates reached for a number demographics including some minority groups, young people and women. The overall unemployment rate stands at less than 4%, so we should expect to see the labor participation rate begin to rise. That rate measures the current workforce percentage employed, adjusted for those in institutions or actively serving in the military. However the participation rate has hardly moved and is still below pre-recession levels. Why? To answer we’ll start by looking at some population changes.
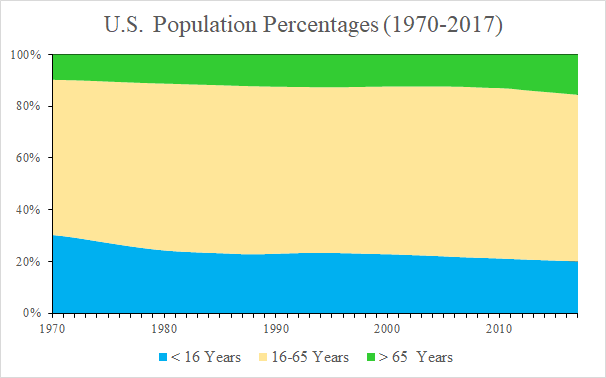 This first chart shows U.S. population changes by three age groups; those under 16, between 16 and 65, and over 65. The first group is not included in employment statistics, but the other groups usually are. The under 16 group decreased by about a third from 30% to just under 20%, while those over 65 increased from 10% to about 16%.[1] This matters as historically those over 65 have participated in the labor force at a much lower rate.
Labor Participation
The next chart shows the U.S. labor participation rate over the same time period. When we break out the participation rates of those over 65 from those below, we see a different story. The grey shaded area in all the charts represents the recession that lasted from Q4 of 2007 to Q3 of 2009. During the recession, the participation rate of those less than 65 decreased by about 5% while it actually rose 1% for those over 65.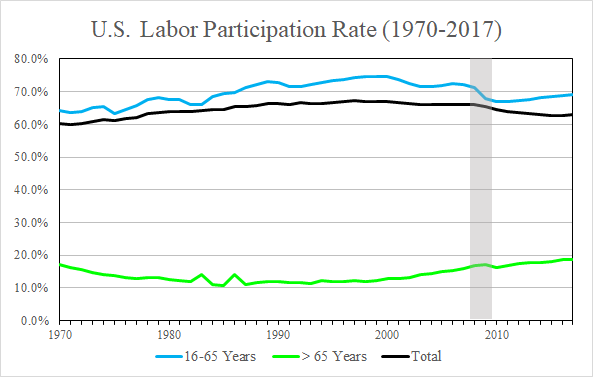
Since the recession’s official end participation rates for both groups increased, with those below 65 rising back toward 70% , where it was just before the recession, while those over 65 are now above where they were in 1970 at almost 20%.[2] However those changes have in part been offset by the shift in population demographics mentioned earlier.
Dropping Out of the Labor Force
But the participation rate is not the end of the story. See the table below. The civilian noninstituational population (CNP) represents the population segment available for work. Formulas for each column are also shown. Two thousand eight marked the first annual measure after the recession began, but it wasn’t until seven years later in 2015 before the unemployed number returned to pre-recession levels. While 10.8 million entered the workforce between 2008 and 2015, 9.8 million of them went into the ‘Not in the labor force’ category. They had given up hope of finding employment and were counted as not looking for work—reducing the participation rate by about 7.5%.
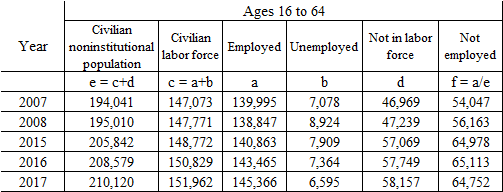 From 2015 through 2017 the figure for those not in the labor force increased by only another 1 million, while the number of employed increased 4.5 million and the number of unemployed decreased by 1.3 million—a positive swing of almost 5 million persons in just two years. Hope is returning, and more people are again employed or looking for work.
Gross Domestic Product (GDP)
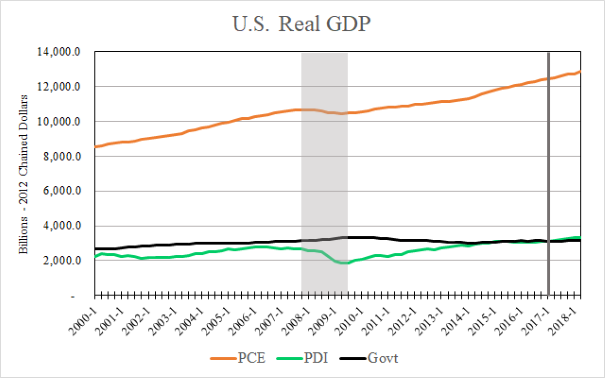 GDP measures economic activity in the form of expenditures. The next chart shows GDP for the following sectors; Personal Consumption Expenditures (PCE), Private Domestic Investment (PDI), and government spending.[3] PCE is primarily consumer expenditures while the larger portion of PDI are business expenditures. Several things to note. One, PCE is by far the largest GDP component. Two, PDI is the most volatile during the eighteen years shown. Three, the government sector is the least efficient as it on average delivers only about $.30 in services for each $1 it takes in.
Government Spending on GDP
Both PCE and PDI decreased significantly during the recession, while government spending increased. The federal government tried to spend its way to prosperity by racking up over $10 trillion in additional debt in just eight years, but it did nothing to improve employment—as we just saw.
 Both PCE and PDI began to increase after the recession, while government spending has held steady. While the recession ended in 2009, it wasn’t until 2013 before PDI expenditures returned to pre-recession levels. The line at Q1 of 2017 marks the administration change from the 2016 election. Both PCE and PDI have continued to increase since the election. More evidence of hope, but hope that began before 2016. Investment is made in anticipation of future returns.
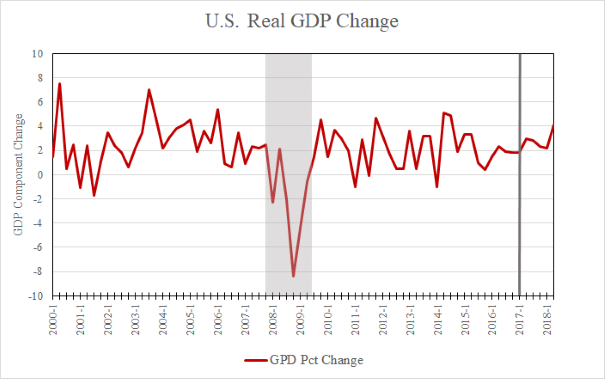
The chart at the left shows the same GDP data as quarterly percentage changes. Even after the recession there were relatively large quarterly swings in GDP for six additional years, with highs above 4% and lows approaching -1%. These began to steady starting in 2016, and since the election growth has been steadier yet and above 2%—with the most recent quarter recently revised upward to 4.2%. Hope translating into greater stability.
Business Start-ups
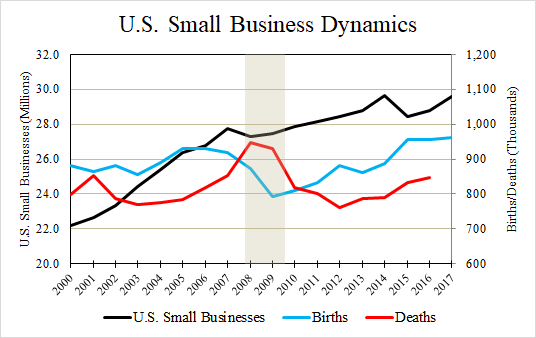 Small businesses make up over 99% of all U.S. firms, and significantly impacts the U.S. economy.[4] During the recession there were fewer business startups than deaths. The number of new businesses increased after the recession, but did not reach pre-recession levels again until five years later in 2014. Why so long?
The total number of small businesses continued to increase through 2014, before losing more than 1 million firms again in 2015—primarily due to conditions in the energy sector. Since 2015 they have again grown and are approaching 30 million firms, over 98% of which have less than 100 people. Startups are again significantly greater than deaths, and the gap is widening, indicating more people are now both willing to risk and invest their capital in a business—and they are more often succeeding. Additional evidence of hope returning.
So What Happened?
None of the things above point to causality, only correlations that lasted five or six years after the end of the recession. Ten million people leaving the workforce, volatile swings in GDP (especially business investment), small business expansions and contractions accompanied by sluggish startups. We can look at the areas of taxes, regulations, corruption and toxicity that created and deepened divides within America during the Obama administration.
Tax Increases
For tax increases, we don’t have to look any further than Obamacare.[5] New taxes or increases in existing taxes include; the individual mandate tax, employer mandate tax, investment surtax, insurance plan excise tax, medicare payroll tax increase, medicine cabinet tax, HSA withdrawal tax increase, medical device tax, Blue Cross/Blue Shield tax increase, charitable hospital excise tax, and health insurer tax. Everyone was taxed, and not only taxed but given many new regulatory mandates to boot.
Regulatory Burden
The Obama administration issued 685 major rules—rules that individually are estimated to have an economic impact of at least $100 million.[6] Over 95,000 new pages of regulations were issued in 2016 alone. It is estimated the administrative costs of all federal regulations places a drag of over $2 trillion on the U.S. economy, about $15,000 per household. This is about a quarter of the U.S. median household income.[7] It not only represents a decreased ability to provide for ourselves, but a loss of freedom as well.
Corruption
As for corruption, there are many scandals and abuses of power that one can point to. Benghazi, the IRS targeting of conservative groups, the Fast and Furious program, and the lies told knowingly about Obamacare to get it passed—to name only a few. We can also look at the Obama administration’s abuses of power in enacting environmental regulations, defying court orders when they impeded its goals, and that administration’s more recent apparent withholding of information to get at least one FISA warrant to spy on a political opponent—again, just to name a few.
The Results
The Obama administration set the tone for the societal division occurring during his eight years. Racial tensions increased and our law enforcement vilified to the point where some are shot. School shootings skyrocketed under his administration.[8] We’ve seen the rise of hate groups such as Occupy Wall Street, Black Lives Matter, and Antifa. Not to mention one member of congress calling for the harassment of current administrative personnel. Again, just to name a few.
Add to that the most recent Democratic infantile antics during the Kavanaugh hearings. As an American, I am ashamed of such behavior—and angry. But we shouldn’t be surprised. Our ideas shape our choices and actions, in this case they are the bad fruit produced by men and women who’ve chosen to turn away from good—who have chosen to do evil. Hate, violence, division, jealousy, and envy are the results of turning away from good—that is, God. These create weakness in a people as it creates division.
The Solution
It is only through good that love, peace, unity, happiness, and joy are created. These produce strength within a people as they become more closely bound together. The data in the previous charts bear that out as we again strive as a people to do the right things. Unfortunately the Democratic senators at the hearings noted above are making the case they would rather rule in hell than serve in heaven. They are weak leaders, but we will only deserve better when we make better decisions.
So the Democrats are right. The current economic growth is due to the Obama administration. His administrative mismanagement led to eight years of repressed economic activity, which is now being tapped. Whatever growth did occur was despite his efforts to the contrary, and not because of them. All it took was undoing the repression the Democrats created and continue to try and create. Kudos for a job well done.
Hope and Confidence
We’ve mentioned hope several times. It is important for a number of reasons. Hope is a virtue. Virtue doesn’t come from choosing vice, but from choosing good. Several things about hope. It is the expectation of good things to come. It is the basis for our actions, and doesn’t change with circumstances. There can be no hope without love, nor love without hope. Finally, love is faith and hope’s fulfillment.[9]
When the virtue of hope becomes established within a person, it leads to confidence. Confidence in being able to make your own choices and doing the right thing, and that doing the right thing will be rewarded instead of penalized. It comes down to hope in the future. Hope can only exist in the light of faith. So in closing, we are going to take a quick look at the business and consumer confidence indices.
 Confidence Indices
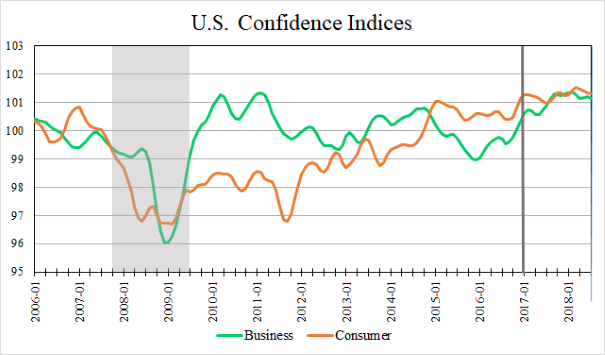
While business confidence increased rapidly after the recession, it generally drifted downward again from 2014 through 2016.[10] Consumer confidence was slower to rise, but didn’t reach pre-recession levels until 2015. Both indices remained flat throughout 2015 and 2016. Both have continued to climb steadily since the 2016 election reaching levels not existing since before the recession.
That leads to the second argument advanced by the Democrats about the economy, and that is the current president will not be able to sustain the current levels of economic growth. They are betting the only way to create growth is through government control. I’ll bet on the American people instead, and so does this president.
Footnotes:
[1] US Census Bureau, https://www.census.gov/popest/data/. Accessed 08/2018.
[2] Bureau of Labor Statics, http://www.bls.gov/. Accessed 08/2018.
[3] U.S. Bureau of Economic Analysis, https://www.bea.gov/data/gdp/gross-domestic-product. Accessed 08/2018.
[4] U.S. Bureau of Labor Statistics, https://www.bls.gov/bdm/entrepreneurship/bdm_chart5.htm. Accessed 08/2018.
[5] Americans for Tax Reform, Full List of Obama Tax Hikes, https://www.atr.org/full-list-ACA-tax-hikes-a6996. Accessed 08/2018.
[6] Sherfinski, David, Obama’s regulations in 2016 to drain economy by $2 trillion, The Washington Times, May 31, 2017. https://www.washingtontimes.com/news/2017/may/31/obamas-regulations-in-2016-to-drain-economy-by-2-t/. Accessed 08/2018.
Also, Gattuso, James, and Katz, Diane, Red Tape Rising 2016: Obama Regs Top $100 Billion Annually, The Heritage Foundation, May 23, 2016. https://www.heritage.org/government-regulation/report/red-tape-rising-2016-obama-regs-top-100-billion-annually. Accessed 08/2018.
[7] Washington Times, Obama’s regulations in 2016 to drain economy by $2 trillion, May 31, 2017, https://www.washingtontimes.com/news/2017/may/31/obamas-regulations-in-2016-to-drain-economy-by-2-t/. Accessed 08/2018.
[8] Wolf, Dan, Failing to Protect Our Children, March 19, 2018. http://www.livingrightly.net/Blog/tabid/87/ID/70/Failing-To-Protect-Our-Children.aspx.
[9] Wolf, Dan, pp. 5-6, A Handbook of Natural Rights, living rightly publications, forthcoming.
[10] Organization for Economic Co-operation and Development, https://data.oecd.org/leadind/consumer-confidence-index-cci.htm. Accessed 08/2018.